Author: Dhritisree *
On 1st June, 2020, Dr. Tedros Adhanom Ghebreyesus, Director General of the World Health Organization (WHO) stated that the impact of COVID-19 extends well beyond the death and disease caused by the virus itself. The pandemic has forced countries to make difficult choices about suspending some health services. Restricted visits to health facilities is the key to keeping people safe and it equally ensures that the health systems are not overburdened. This means health services have been affected in care for people with any other communicable or non-communicable diseases, including diabetes, cancer, cardio vascular diseases or chronic respiratory disease, tuberculosis, diarrhoea and so on. People living with vulnerable diseases can become severely ill or die due to COVID-19. At the same time, many people are not able to access the required medicine or medical help for their other diseases, hence, becoming severely ill or reaching the inevitable. WHO conducted a rapid assessment of service deliveries for non-communicable diseases during the COVID-19 pandemic, with 155 countries submitting data. The results show that more than half of the countries surveyed, have partially or completely disrupted services for treatment of hypertension, half for treatment of diabetes and related complications, 42 percent for cancer treatment and 31 percent for cardio vascular emergencies.
It’s been three weeks that India has reopened with restrictions after observing two months of prolonged lockdown. The health facilities are yet to resume all provisions for diseases other than COVID-19. Like many other countries in the world, the ailing patients with other fatal diseases in India were not the primary focus in the health care ladder since the commence of the pandemic. Most of the hospitals in the affected areas were coping to fight against COVID-19. Hence, other patients were discouraged to visit hospitals unless it is absolute necessary. Surgeries, chemotherapy, regular pathological tests and follow ups with doctors which could be avoidable during the surge, were postponed. The prevalent fear of germs and infection from the COVID-19 affected patients also stopped people to visit health care centres. Everyone became even more helpless when some of the drugs were scarce in their local medicine shops during the lockdown. Under such state of turmoil, let us enquire what was India’s morbidity status in pre-pandemic era and who are more vulnerable during the pandemic due to their existing adverse health status. This article tries to understand the prevalence of non-communicable and communicable diseases across the states, especially in the states where the spread of the pandemic is more. Diseases other than COVID-19 will not be the prime focus for long in the states with vast spread for longer period.
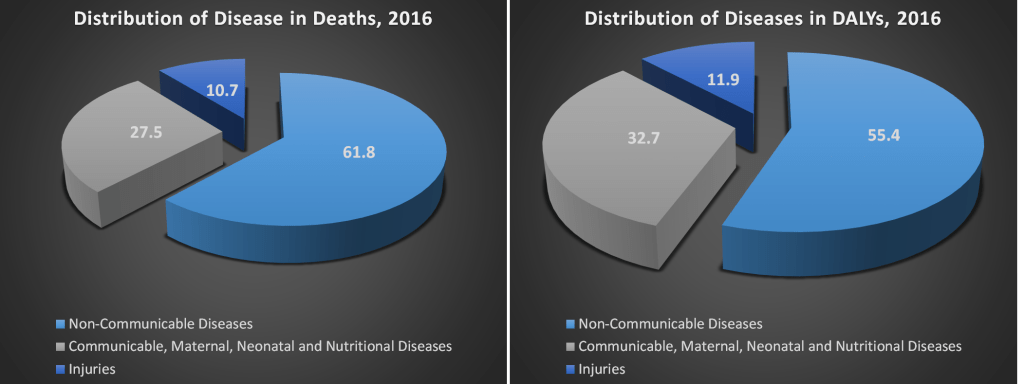
The burden of disease in any country is majorly determined through ‘disability-adjusted life-years’ or DALYs. It is defined as the number of years lost due to ill-health, disability or early death. Here, both mortality and morbidity are considered to make this metric and it is increasingly used as a common method to assess the health impact in the world. According to Lancet study in 2017, there were about 9.7 million deaths and 486 million DALYs in India. The causes of death and DALYs in India can be divided into three broad categories – non-communicable diseases (NCDs); communicable, maternal, neonatal and nutritional diseases (CMNNDs); and injuries. NCDs consist of cancer, cardiovascular disease, chronic respiratory diseases, cirrhosis and other chronic liver diseases, digestive diseases, neurological disorders, mental and substance use disorders, diabetes, urogenital, blood and endocrine diseases, musculoskeletal disorders and other non-communicable diseases. CMNNDs consist of HIV/AIDS and tuberculosis, diarrhoea, lower respiratory and other infectious diseases, neglected tropical diseases and malaria, maternal disorders, neonatal disorders, nutritional deficiencies, other communicable, maternal, neonatal and nutritional diseases. Finally, injuries consist of transport injuries, unintentional injuries, suicide and interpersonal violence and other injuries.
Non-Communicable and Communicable Diseases
India has gone a major epidemiological transition over the last three decades. The country’s disease patterns have shifted. Mortality and DALYs due to CMNNDs have declined significantly which means NCDs and injuries are increasingly contributing to overall disease burden. Here, epidemiological transition means the ratio of CMNNDs cases to NCDs and injury cases. According to the above pie chart, almost 62 percent of the deaths and around 55 percent of the DALYs are caused by NCDs in 2016. Around 27 percent of the deaths and 33 percent of the DALYs are triggered by CMNNDs. Almost 11 to 12 percent of deaths or DALYs are caused by injuries.
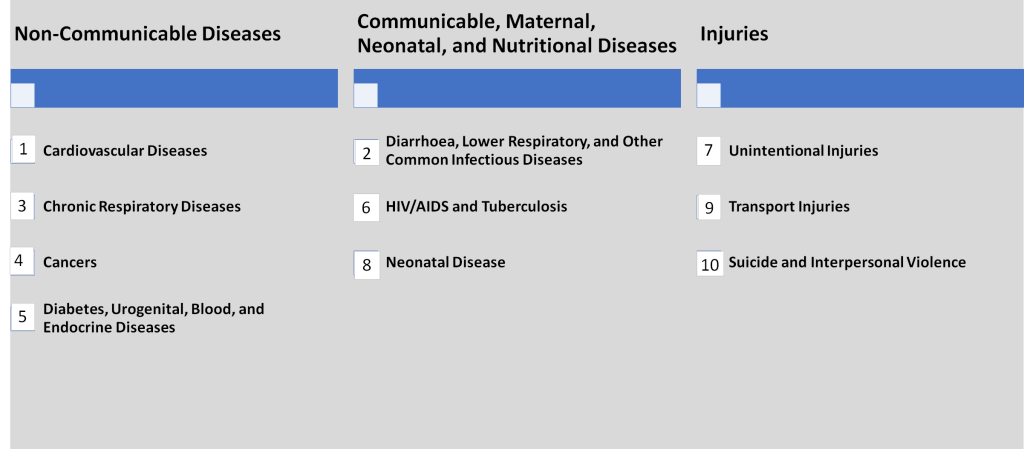
The top ten causes of death in India are listed above with their respective order. Cardiovascular disease being the top cause (28 percent) and diarrhoea, lower respiratory and other common infectious diseases being the second most cause of deaths (15.5 percent). This list clearly states that there are four causes out of top five causes to deaths are non-communicable in nature. Lack of access to medical facilities during this pandemic has left all existing patients with any disease completely vulnerable and helpless. This is more so for the patients with NCDs since the existing ratio of NCDs (and injuries) to CMNNDs is already higher.
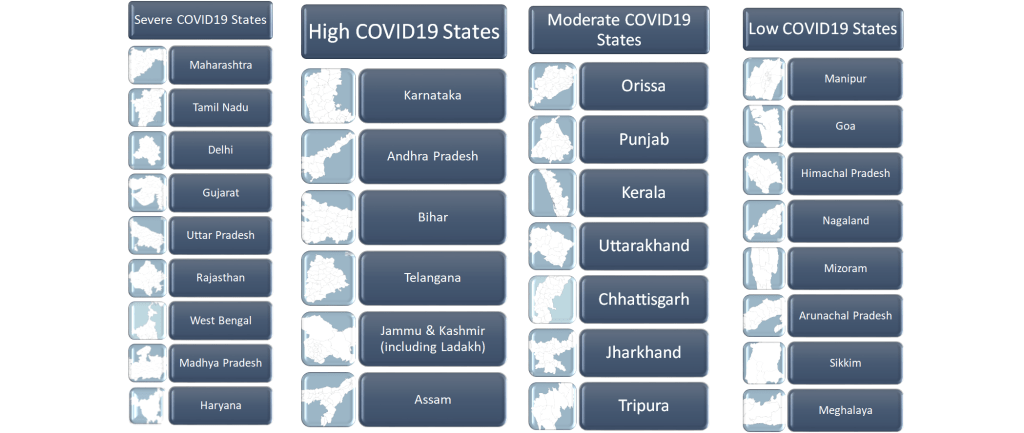
Above, all the states are listed according to their intensity of COVID-19 spread. There are four groups – low, moderate, high and severe COVID-19 groups. The states with less than 1000 cases are part of low COVID-19 group. All the north-eastern states (excluding Assam, Tripura), Himachal Pradesh and Goa are part of this group. The states with more than 1000 cases but less than 5000 cases are part of moderate COVID-19 group. There are seven states in this group – Orissa, Punjab, Kerala, Uttarakhand, Chhattisgarh, Jharkhand, and Tripura. States like Karnataka, Andhra Pradesh, Bihar, Telangana, Jammu & Kashmir (including Ladakh) and Assam belong to high COVID-19 group with more than 5000 cases but less than 10,000 COVID-19 cases. Severe COVID-19 group has all the states with more than 10,000 cases and they are Maharashtra, Tamil Nadu, Delhi, Gujarat, Uttar Pradesh, Rajasthan, West Bengal, Madhya Pradesh and Haryana. By combining the existent status of the states on non-communicable and communicable diseases and the intensity of the pandemic spread in each state, let’s see what it suggests.

The epidemiological transition level (or the share of communicable to non-communicable and injuries) of all the states are given in the above graph with the average being 0.45 (the blue line). The movement of epidemiological transition level towards 0 from 1 depicts that the share of NCDs (and injuries) is increasing compare to CMNNDs in the population. Therefore, lower the ratio, higher the cases of non-communicable diseases. The states which lie below the average line are the ones where the share of CMNNDs to NCDs (and injuries) are lower than average, hence, the share of NCDs is greater than CMNNDs. There are nine states where the epidemiological transition level is lower than the average in the high and severe groups of COVID-19 spread. Telangana, Andhra Pradesh, Karnataka and Jammu & Kashmir are the ones in high COVID-19 group. In the severe COVID-19 group, there are Haryana, Delhi, Maharashtra, West Bengal and Tamil Nadu, which have lower epidemiological transition level than average. In these twelve states, both the share of NCDs and COVID-19 spread are higher, hence, indicating acute suffering among NCDs patients in those states as the primary focus of health will still be on COVID-19 for many days in near future. The number of deaths or DALY due to NCDs may see a spike during this mayhem in these states. According to MoHFW, GOI, 2017 report, cardiovascular disease causes the highest percentage of death among NCDs (28 percent), second is chronic respiratory diseases (11 percent) and the third is cancer (8 percent). Now, let’s see the status of these three diseases across each state and especially, the states where COVID-19 spread is high.
Non-Communicable Disease: Ischaemic Heart Disease
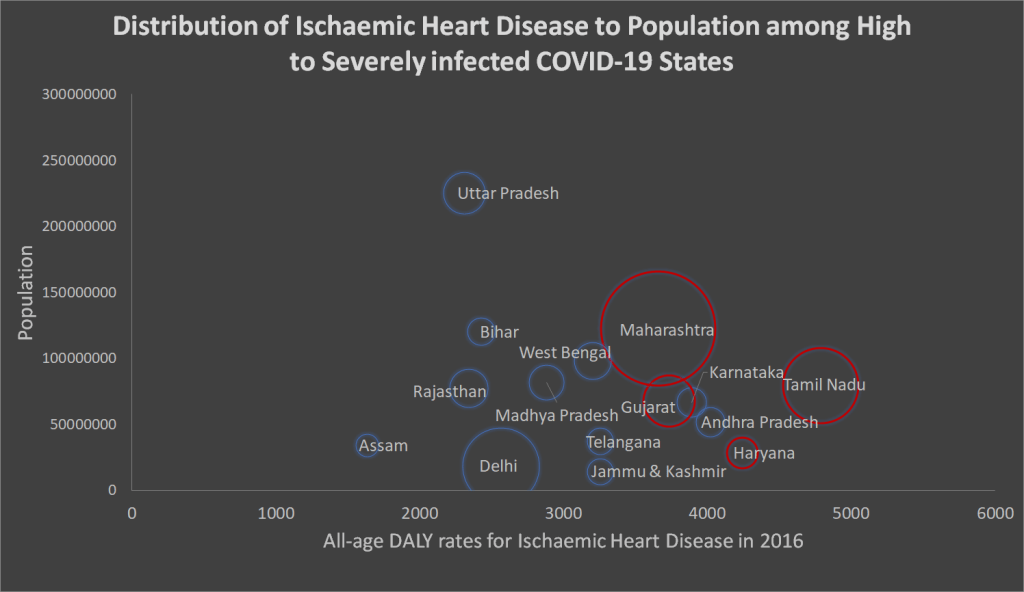
According to the same report, the number of prevalent cases of cardiovascular diseases has increased from 2.57 crore in 1990 to 5.45 crore in 2016. The prevalence is the highest in Punjab followed by Tamil Nadu. The all-age DALY rates for ischaemic heart disease across the states with high and severe COVID-19 spread are plotted in the above bubble graph. Each bubble represents a state. The horizontal axis represents the DALY rates of each states while the vertical axis represents the number of population in each state. Finally, the size of the bubble represents the spread of COVID-19. The states which are situated on the right end of the graphs, example – Tamil Nadu, Haryana, Andhra Pradesh have more than 4000 DALY rates for ischaemic heart diseases whereas states like Jammu & Kashmir, Karnataka, Telangana, Gujarat, Maharashtra and west Bengal have DALY rates in between 3000 to 4000. Therefore, the diseases burden due to heart diseases reduces as we move from right to left. The states with red borders are the ones which have high DALY rates (more than national average) for ischaemic heart disease and have severe COVID-19 spread. These are Maharashtra, Tamil Nadu, Gujarat and Haryana where the primary health focus is on COVID-19 due to its daily spread but at the same time, the cardiovascular disease burden is also high in these states. Hence, the health care system of these states needs to provide a special attention to cardiovascular cases. Andhra Pradesh and Karnataka are the two states where the DALY rates of ischaemic heart disease is high (more than national average) but their COVID-19 spread is still not severe. Hence, these two states do not have red border but they, too, should put extra attention towards cardiovascular cases.
Non-Communicable Disease: Chronic Obstructive Palmonary Disease
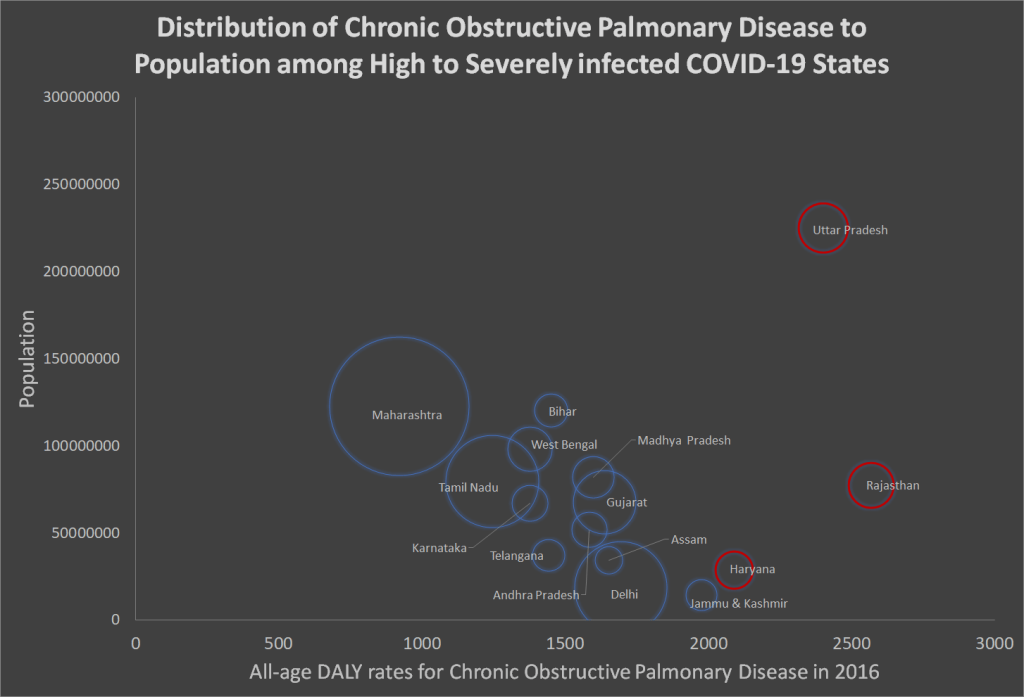
Chronic obstructive pulmonary disease or COPD causes the second highest percentage of death among NCDs (11 percent). The all-age DALY rates for COPD across the states with high and severe COVID-19 spread are plotted in the above bubble graph. States like Uttar Pradesh, Haryana, Rajasthan and Jammu and Kashmir have DALY rates more than 2000 which is more than national average and considered to be high. Three of the four aforementioned states belong to severe COVID-19 group. Hence, these three states, Uttar Pradesh, Rajasthan and Haryana, have critical condition for both COVID-19 and COPD.
Non-Communicable Disease: Cancer
Source: Projection of Cancer Incident Cases for India -Till 2026 by Neevan DR Dsouza, NS Murthy and RY Aras,
Asian Pacific Journal of Cancer Prevention, Vol 14, 2013 and http://www.covid19india.org; Dated – 20.06.2020
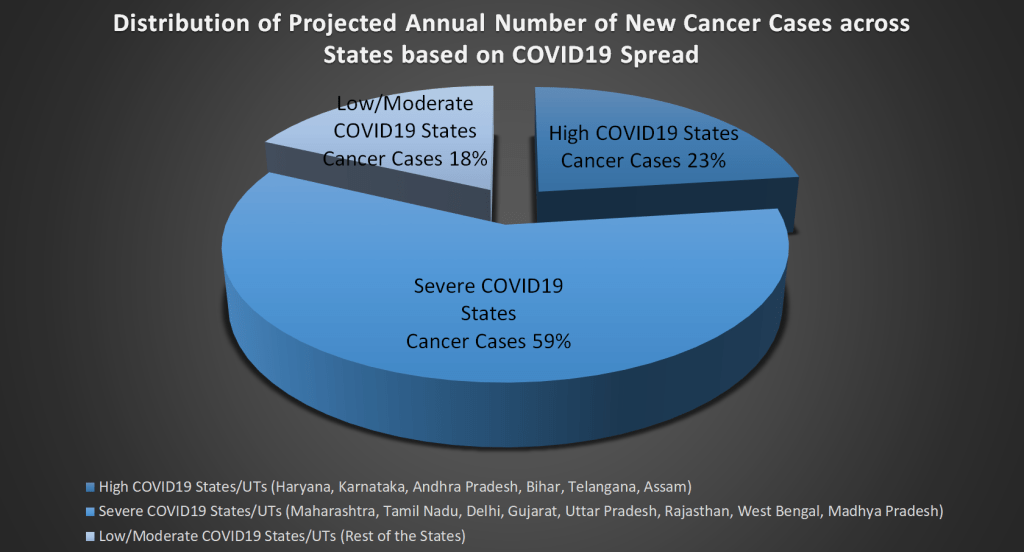
Cancer causes the third highest percentage of death among NCDs (8 percent). According to WHO, India witnessed more than 11 lakhs new cancer cases and 7.8 lakhs cancer deaths in 2018. A research published in Asian Pacific Journal of Cancer Prevention, 2013, estimated that there will be 16 lakhs new cancer cases in India by 2021. The above graph merges the projected annual number of new cancer cases of each state by 2021 with their respective COVID-19 spread and delivers an important concern. The states with severe COVID-19 spread, where many health provisions are still restricted, share 59 percent of the new cancer cases projected for 2021. In another word, more than half of the new cancer cases belong to the states where intensity of COVID-19 is high. Around 23 percent of the new projected cancer cases are from the states with high COVID-19 spread. Hence, 82 percent of the new projected cancer cases might not receive the deserved medical attention in the high and severe COVID-19 zones.
Asian Pacific Journal of Cancer Prevention, Vol 14, 2013 and http://www.covid19india.org; Dated – 20.06.2020; The number of Telangana is added up to Andhra Pradesh*
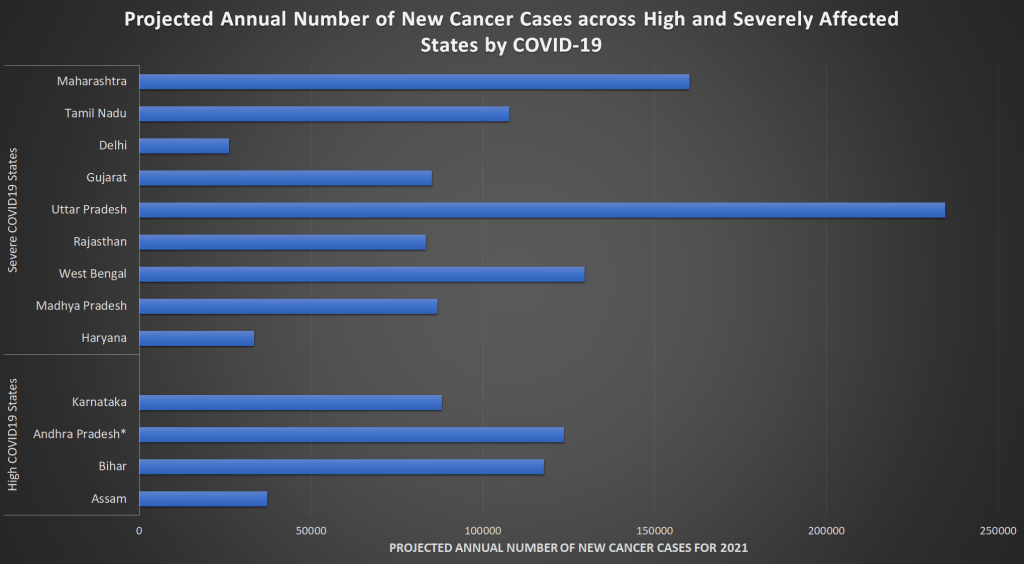
The projected annual numbers (2021) of new cancer cases for each state of severe and high COVID-19 groups are plotted above. Uttar Pradesh is projected to report the highest number of cancer cases followed by Maharashtra and West Bengal. All these three states have more than 10,000 COVID-19 cases currently. Thus, the focus of the health care is primarily consolidated on the pandemic and provision of cancer treatment has taken a back stage. The only relief lies in the fact that this numbers are projected and that too, for 2021. Nevertheless, given the number of new cancer cases in 2016, this estimation is not too far from the reality.
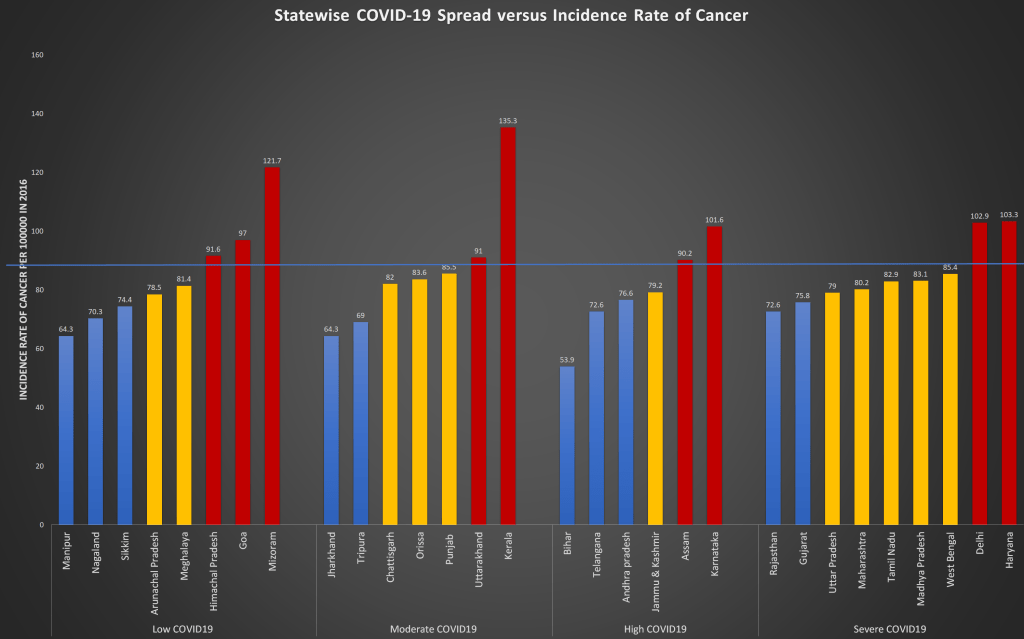
The above graph has plotted the incidence rate of cancer of each state (from 2016) with their respective group of COVID-19 spread. Incidence rate of cancer means the number of new cases per 1,00,000 people. This is not projection but exact new cases per lakh people in 2016. The blue straight line refers the national average of the incidence rate. There are two states each from severe (Haryana, Delhi) and high (Karnataka, Assam) COVID-19 groups which have higher incidence rate of cancer per 1,00,000 in 2016. Therefore, these four states will be affected in terms of caring cancer followed by states like West Bengal, Madhya Pradesh, Tamil Nadu, Maharashtra, Uttar Pradesh and Jammu & Kashmir with incidence rate of cancer equivalent to national average.
Communicable Disease: Diarrhoeal Diseases and Lower Respiratory Infections
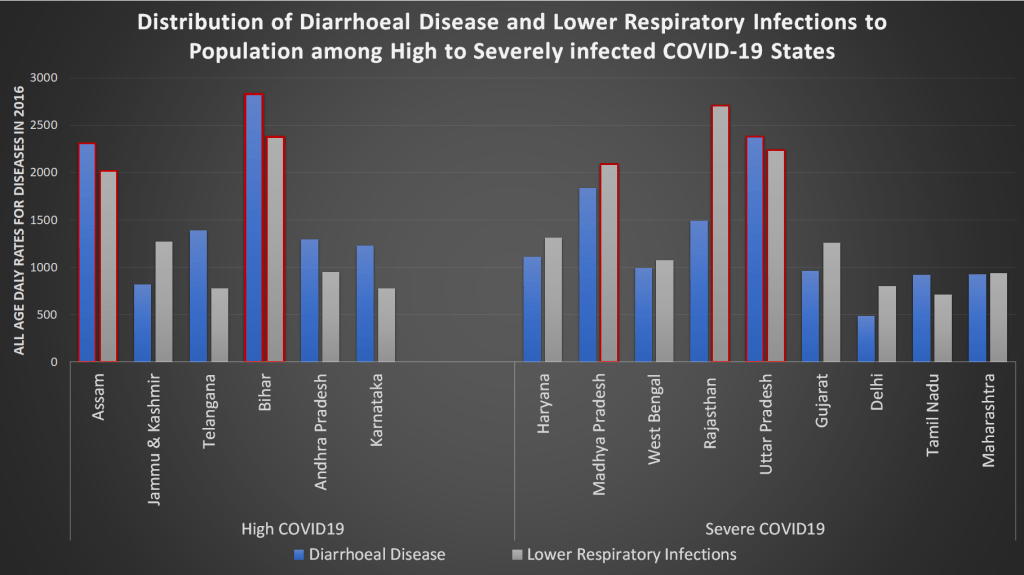
Diarrhoea, lower respiratory and other common infectious diseases cause the highest percentage of death among communicable, maternal, neonatal, and nutritional diseases or CMNNDs (15.5 percent) according to a report by MOHFW, GOI in 2016. All-age DALY rates of Diarrhoeal disease (blue bar) and lower respiratory infections (grey bar) of each state belong to high and severe COVID-19 groups are plotted above. Here, the blue and grey bars with red border represent the states where respective disease has extended beyond the national average. The three states, Assam, Bihar and Uttar Pradesh have high prevalence of diarrhoeal diseases and simultaneously, they have higher number of COVID-19 cases currently. The five states, Assam, Bihar, Madhya Pradesh, Rajasthan and Uttar Pradesh have high prevalence of lower respiratory infections generally and higher number of COVID-19 cases currently. Therefore, these are the states which might experience more challenges with additional burden of these communicable diseases in the period of pandemic. Predominantly, the three states, Assam, Bihar and Uttar Pradesh have more prevalence of both the CMNNDs but less representation in NCDs above.
Communicable Disease: HIV/AIDS and Tuberculosis
HIV/AIDS and Tuberculosis (TB) cause the second highest percentage of death among communicable diseases. India has the third largest HIV epidemic in the world with 21 lakhs HIV patients in 2017. According to India TB report in 2018, the estimated TB incidence in India is 27 lakhs with more than 2 lakhs deaths are reported per year. Both, HIV/AIDS and TB diseases have several common threads. Namely, both the diseases are caused by poverty. Maximum patients of both the diseases vastly depend upon the public healthcare system for treatment in India. Anti-retroviral therapy (ART) is followed to treat HIV/AIDS patients which requires regularity since irregular regimen can lead to resistance to drugs and therefore, can weaken or negate its effect. Directly observed therapy (DOT) is used to cure TB in India which requires strict surveillance of health workers during the time of medication consumption by the patients, otherwise irregular medicine consumption lead to drug resistance and incomplete treatment. During the lockdown and in the time of initial unlock days, both ART and DOT plummeted as the public healthcare system is completely disrupted due to the pandemic. It will not come as a surprise if there is a spike in death rates due to HIV/AIDS and TB. One has to remember that the patients affected by these diseases belong to lower strata of the income ladder and their livelihood is completely ruined during the lockdown. The situation will not get any better in the ongoing and coming economic slowdown.
HIV/AIDS

The above graph combines the annual number of new HIV cases of each state with their respective COVID-19 spread. According to a HIV report published in 2015, the states with severe COVID-19 spread, where many health provisions are currently limited, share 57 percent of the new HIV cases. Around 24 percent of the new HIV cases are from the states with high COVID-19 spread. Hence, 81 percent of the new HIV cases might not receive the deserved medical attention in the high and severe COVID-19 zones.
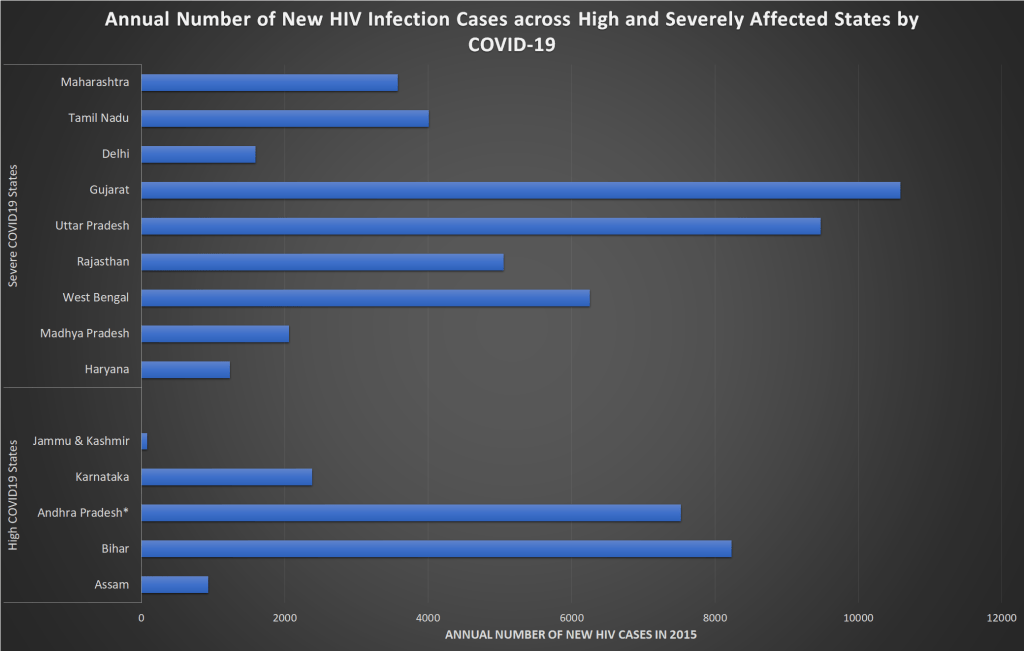
The annual number of new HIV cases for each state in the severe and high COVID-19 groups are plotted above. In severe COVID-19 group, Gujarat has the highest number of HIV cases followed by Uttar Pradesh and West Bengal. Currently, these three states have more than 10,000 COVID-19 cases each.
Tuberculosis
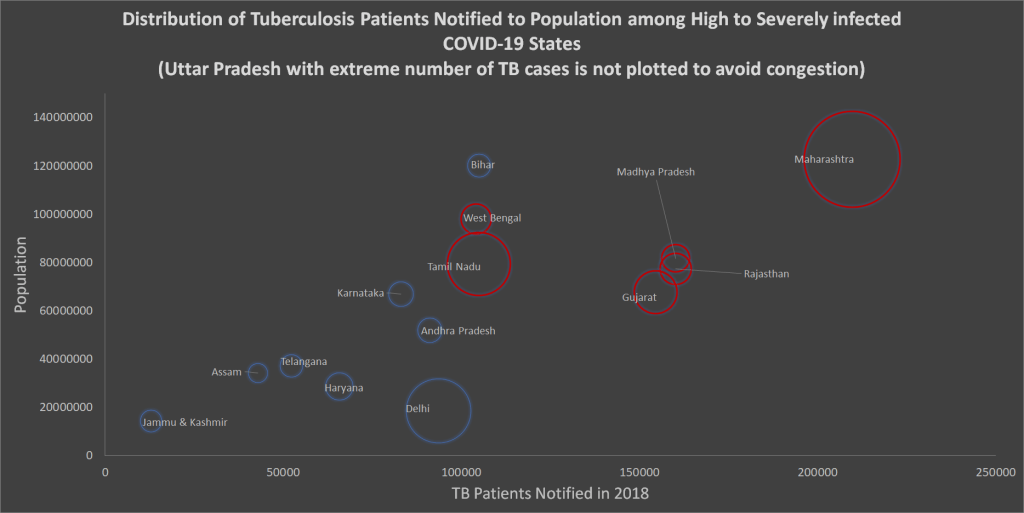
A primary job of health workers devoted for TB cure is to find out possible TB affected people by running tests and finally start treatment after notifying them. The above bubble graph represents number of tuberculosis patients notified in 2018 for each state from high and severe COVID-19 groups. The horizontal axis represents the number of TB patients notified in 2018 and the vertical axis represents the population. Each bubble represents each state where size of the bubble being the number of COVID-19 cases. On the horizontal axis, the movement from left to right refers to increase in notified TB patients. States like Gujarat, Rajasthan, Madhya Pradesh and Maharashtra have more than 1,50,000 new TB patients who were notified in 2018. The bubbles/states with red border are the ones which have both high cases of TB and COVID-19. These are Maharashtra, Tamil Nadu, Gujarat, West Bengal, Rajasthan, Madhya Pradesh and Uttar Pradesh. Here, only Uttar Pradesh is not present in the graph since the inclusion of Uttar Pradesh in the graph was congesting the clean visibility of other states. Uttar Pradesh has excessively high number of TB patients notified. Inclusion of such extreme number in bubble graph might cluster the other bubbles/states together, hence, endangering the clean visibility. Here, one has to remember that Uttar Pradesh has extreme high number of TB patients notified and it belongs to high COVID-19 group. Like the TB patients of Maharashtra, Tamil Nadu, Gujarat, West Bengal, Rajasthan and Madhya Pradesh, the TB patients of Uttar Pradesh, too, are vulnerable in the period of pandemic due to lack in health care support.
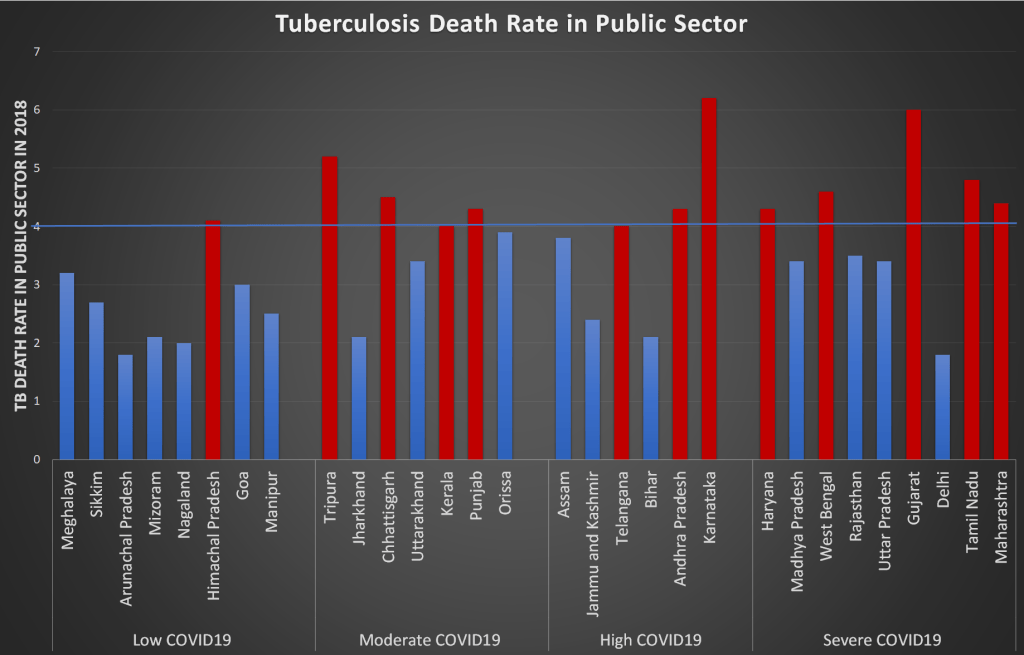
Furthermore, the states which have already high death rate due to TB might face additional challenges. The above graph plots the death rate due to TB in public sector for 2018 where states like Telangana, Andhra Pradesh, Karnataka, Haryana, West Bengal, Gujarat, Tamil Nadu and Maharashtra have higher death rate than national average and they belong to either high or severe COVID-19 group currently. These states might face similar or more death rate due to TB during this period.
Maternal, neonatal and nutritional diseases are also considered under CMNNDs by definition. Discussion on maternal, neonatal and nutritional diseases have not been undertaken in this article since it has been already discussed in the preceding article. It can be available here (https://ipdonline.net/2020/05/06/infant-health-care-challenges-in-the-midst-of-covid-19/). The aforesaid article concluded that the pandemic stricken health care system is lagging behind in maternal, antenatal and neonatal care. The same article also talks about how the pandemic can impact the malnutrition status of the country.
In a nutshell, this pandemic has enforced to rearrange the priorities of health care system which in turn has impacted all kinds of ailed population with any other morbidity. Seemingly non-fatal diseases may turn into fatal during such pervasive environment. Therefore, the death rate may not only increase due to pandemic alone but also due to lack of supervision in other health care supports. The patients with chronic disease such as diabetes, urogenital, endocrine, neurological diseases are not able to do their regular pathological tests and follow ups with doctors due to the fear of spread of pandemic from the hospitals. These regular monitoring procedure often helps to detect and prevent some severe health issues in future. As anyone is visiting hospital due to extreme emergency other than the pandemic, sometimes they are entertained only after testing for COVID-19. Therefore, the specific medical help is reaching late sometimes and turns to be too late many a times.
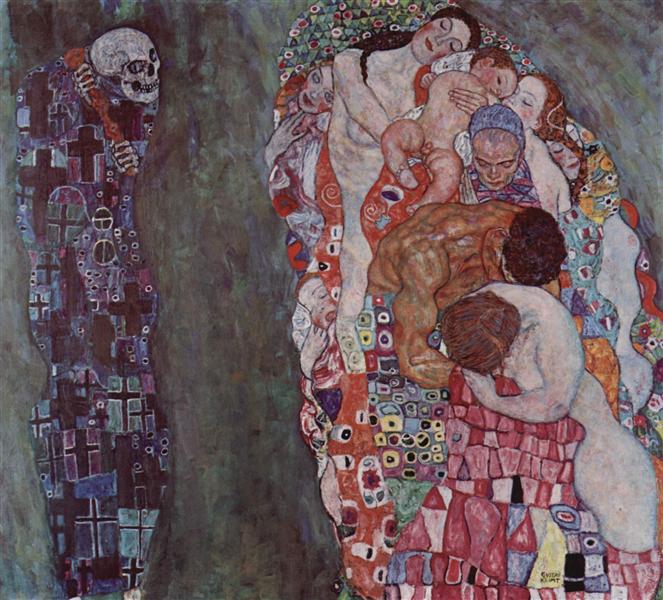
At the end of the tunnel, some will survive and some may not. COVID-19 pandemic is vastly getting compared with the Spanish flu of 1919 which wiped off millions. Among other famous artists who died of the Spanish flu were Gustav Klimt, Amadeo de Souza Cardoso, Niko Pirosmani and Egon Schiele. The painting above is one of the masterpieces by Gustav Klimt, called ‘Death and Life’, which he created in 1911, a couple of years before the world was set on fire with First World War, followed by Spanish flu. Ironically, the later is the cause of his death. The personification of death became integral part of art mostly because of Middle-age’s plague epidemic. Though this painting does not recall the torment of such epidemic but reminds the universal norm of beginning, symbolizing with life and end, symbolizing with death. The painting has two parts where on the left side, death is waiting and gazing at life. On the right side, bodies from every age group are huddled together to signify life. This painting evokes the parallel existence of death and life. This painting could be interpreted in several ways and probably, there lies the triumph of artwork. Essentially today, because of the humongous disruption of life due to pandemic, let’s interpret this painting on a promising note. Let’s hope that the life will elude the grasp of death and continue to celebrate humanity.
Note: The UTs are not considered in the graphs to improve visibility. Only Delhi and Jammu and Kashmir are considered since Delhi is the capital and Jammu and Kashmir was a state till 2019. The data on Ladakh from covid19india.org is added to Jammu and Kashmir to make the data comparable. Prior to 2014, Telangana was part of Andhra Pradesh and established as separate state identity only in 2014. Therefore, the bar graphs of the projected annual number of new cancer cases and annual number of new HIV infection cases have both Andhra Pradesh and Telangana as single identity and called Andhra Pradesh*.
*Dhritisree is a PhD in Economics from Indira Gandhi Institute of Development Research (IGIDR), Mumbai. She did her Masters in Economics from Jawaharlal Nehru University, New Delhi. Her research areas include Development Economics, Gender, Health and Agricultural Economics.
Kindly note that the point of views expressed in the article are entirely the author’s personal views. IPD takes no responsibility for the same.
