by Trinanjan Chakraborty
Last month, extreme heatwaves killed close to 200 people in US Pacific North-West: 116 in Oregon and 78 in Washington. The heatwaves also killed more than 500 people in British Columbia. In Vancouver, record high temperatures led to tens of thousands of clams, sea-stars, mussels and snails boiled alive on the Kitsilano beach.

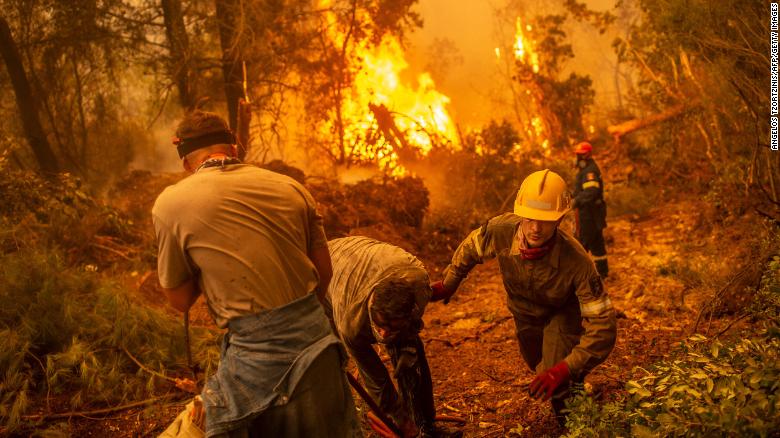
In recent years, the state of California has witnessed some of the largest, deadliest and most destructive wildfires in the state’s history. If the residents thought last year’s wildfires were the worst, 2021 has brought a new nightmare. The Dixie fire has now been recognized as the single largest and most devastating wildfire in California history. 39% of the Plumas county is now under evacuation orders as thousands fled to save their lives as their homes were grasped by the flames. 106 other wildfires are raging across 13 other American states.
Greece, Italy and Turkey all have been ravaged by wildfires very recently. 586 wildfires rage across Greece, prompting the country’s prime minister to declare it a “natural disaster of unprecedented proportions.” Meanwhile, in what is a historic first, smoke from wildfires in Siberia have reached the North Pole. The frequency and ferocity of wildfires have increased rapidly in Siberia in recent years according to Russian observers. In Turkey, over 2000 wildfires destroyed 1600 sq. KMs of forest cover during the months of July & August.
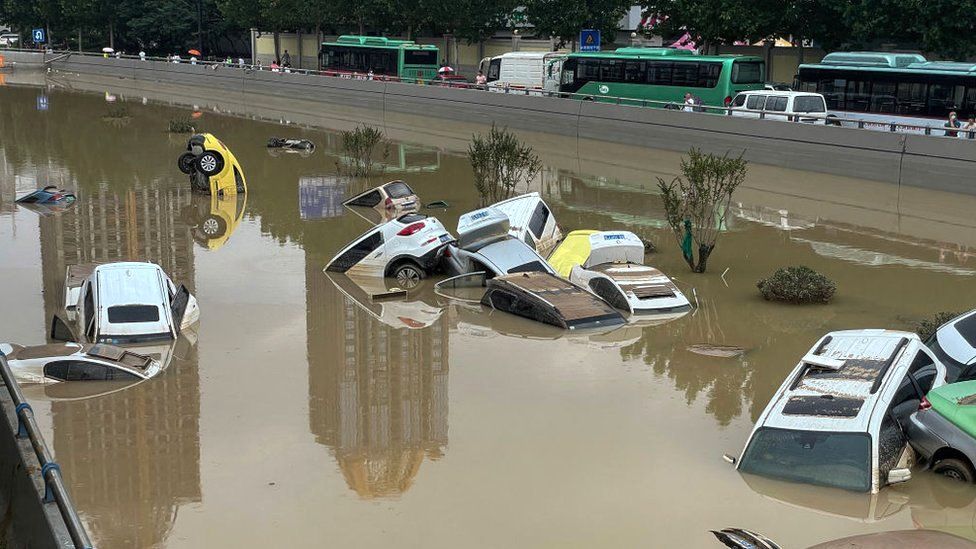
Less than a month ago, devastating rains swept across UK, western Germany, Netherlands, Belgium and Luxembourg. The impact was worst in Germany where the resultant floods led to more than 180 deaths – the worst natural disaster to hit the nation in nearly half a century. In Belgium, 42 lives were lost. In China, the heaviest rainfall in a thousand years has affected 1.24 million people and necessitated 1.60 lac evacuations. The city of Zhengzou received as much rainfall in little over 3 days as it does in one full year. Across northern and eastern India, unprecedented floods and landslides have claimed close to 150 lives.
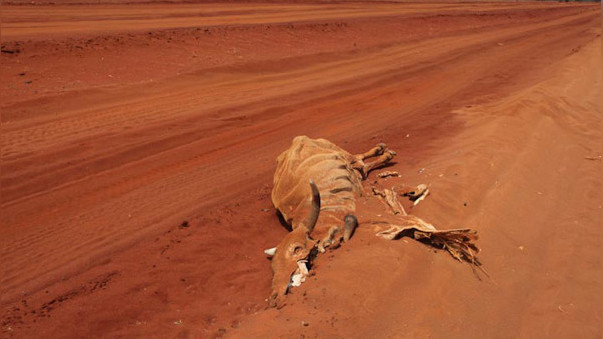
Three months ago, an ice berg thrice the size of India’s capital Delhi broke off from the Ronne ice shelf in Antarctica. With a surface area of 4320 sq. KMs, it is the biggest ice berg currently floating in world waters. It is estimated that 40% of arctic ice cover has been lost post 1975. Meanwhile, with mercury hitting record highs, the Emirate of Dubai recently resorted to cloud seeding in order to bring about artificial rain. In Kazakhstan, extreme heat waves and drought have killed thousands of cows and horses.
Across the world, climate patterns have increasingly become more abnormal, erratic and intense in the last decade. Yesterday, the UN’s Inter-governmental Panel on Climate Change (IPCC) released its 6th assessment report pertaining to working group-I which deals with scientific basis for climate change. The report is prepared basis inputs from more than 750 scientists who have reviewed over 14000 publications in the process. The report does not make for a pretty read. It flashes a CODE RED for humanity with respect to climate change. Some of the major observations in the report are as below:
- Each of the last four decades has been successively warmer than any decade that preceded it since 1850. Global surface temperature during the last decade (2011-’20) was 1.09°C higher compared to pre-industrialization levels (1850-1900). The likely human-caused surface temperature rise was 1.07°C
- Global surface temperatures have increased faster since 1970 than in any other 50-year period in at least last 2000 years. Temperatures during the most recent decade (2011-’20) exceed the most recent multi-century warm period, approximately 6500 years ago (0.2 to 1°C relative to 1850-1900)
- Hot extremes over land (including heat waves) have become more frequent and more intense since the 1950s while cold extremes have become less frequent and less intense in the same period. Human agency is considered the primary causal factor for these changes
- Globally averaged precipitation over land has likely increased since 1950 with faster rate of increase since 1980. The frequency and intensity of heavy precipitation events have increased since the 1950s over most land area for which sufficient data is available for trend analysis
- Human activities almost solely responsible for increase in global upper ocean (0-700 m) temperature rise since 1950. Human-caused C02 emission is the lead driver of acidification of surface open ocean. The global ocean has wormed faster over the past century than since the end of the last de-glacial transition (around 11,000 years ago). Marine heatwaves have approximately doubled in frequency since the 1980s
- In 2011-’20, annual average Arctic Sea ice area reached its lowest level since 1850. Late summer Arctic ice area was smaller than at anytime in the past 1000 years. The global nature of glacial retreat, with almost all glaciers retreating synchronously, since the 1950s is unprecedented in at least last 2000 years
- Global sea levels have risen by 20 centimeters between 1901 and 2018. The average rate of increase was 1.3 mm/year between 1901 and ’71, increasing to 1.9 mm/year between 1971 and 2006, and further increasing to 3.7 mm/year from 2006 to ’18. The increase in mean global sea level since 1900 is faster than over any preceding century for the last at least 3000 years. The rate of ice sheet loss increased by a factor of four between 1992-’99 and 2010-’19
- Changes in land biosphere since 1970 are consistent with global warming patterns. In both hemispheres, climate zones have shifted pole wards
- It is likely that global proportion of major tropical cyclone occurrence (categories 3-5) has increased over the last four decades
- In 2019, CO2 concentrations in the atmosphere were higher than at any time in at least past 2 million years and concentrations of CH4 and N20 higher than any time in the last 800,000 years
- Since the end of the 1950s, forests, soil and oceans (dubbed carbon sinks) have absorbed 56% of carbon produced due to human activity. In the same time, the said carbon production has increased by 1.5 times. But these human allies are increasingly showing signs of saturation and the % of human carbon emissions they are absorbing is steadily on the decline
LIKELY FUTURE TRENDS IDENTIFIED IN THE REPORT:
- Compared to 1850-1900, global surface temperature averaged over 2081-2100 is very likely to be higher by: 1.0°C – 1.8°C under the very optimistic scenario (very low Green House Gas emissions) | 2.1°C – 3.5°C in the intermediate scenario (moderate GHG emissions) | 3.3°C – 5.7°C under the reckless scenario (very high GHG emissions). The last time global surface temperature was sustained at or above 2.5°C (reference 1850-1900) was over 3 million years ago
- It is virtually certain that the land surface will continue to warm more than ocean surface: likely 1.4 – 1.7 times more. It is also virtually certain that Arctic will continue to warm more than the global surface temperature – likely two times the rate of global warming (high confidence)
- A warmer climate will intensify very wet and very dry weather and climate events and seasons
- Every additional 0.5°C increase in global warming causes clearly discernible increase in the intensity and frequency of hot extremes, including heatwaves, and heavy precipitation as well as agricultural and ecological draughts in some regions. With additional global warming, the frequency of marine heatwaves will continue to increase (high confidence), particularly in the tropical ocean and the Arctic (medium confidence)
- The average annual global land precipitation is projected to increase by 0 – 5% under the very optimistic scenario, by 1.5 – 8% in the intermediate scenario and by 1 – 13% under the reckless scenario. Precipitation is projected to increase over high latitudes, the equatorial Pacific belt and parts of the traditional monsoon regions but decrease over parts of the sub-tropics and limited parts of tropical belt. Also predicted (with high confidence) is earlier onset of spring snowmelt, with higher peak flows at the expense of summer flows in snow-dominated regions globally
- Monsoon precipitation is projected to increase in the mid-to long term at global scale, particularly over South and Southeast Asia, East Asia and West Africa apart from the far west Sahel
- Mountain and polar glaciers are predicted to continue melting over coming decades and centuries (very high confidence). Continued ice loss over the 21st century is virtually certain for the Greenland Ice Sheet and likely for the Antarctic Ice Sheet
- Virtually certain that global mean sea level will continue to rise over 21st century. Relative to 1995-2014, the likely global mean sea level rise by 2100 is 0.28 – 0.55 mm under the very optimistic scenario, 0.44 – 0.76 mm in the intermediate scenario and 0.63 – 1.01 mm under the reckless scenario
THE CLOCK IS TICKING :
The planet is now definitely headed towards 1.5°C increase of global surface temperatures (reference: 1850-1900) in the next two decades under all five scenarios – from the very optimistic (very low GHG emissions) to the reckless (very high GHG emissions). That is a full decade earlier than predicted by the IPCC just three years ago. The planet is literally sitting on a ticking time bomb.
THE WAY AHEAD:
Immediate aggressive action to limit GHG emissions are only way to stop catastrophe. If the world can achieve net-zero GHG emissions by mid-century, then global temperature rise can be controlled to about 1.6°C in 2050 and brought down to 1.4°C by 2100 (reference: 1850-1900). Conversely, in the other extreme (scenario reckless), temperatures are likely to increase by 2.4°C by mid-century and by 4.4°C by end of the century (reference: 1850-1900).
The world’s remaining carbon budget — the total amount that can be emitted and still have a likely chance of limiting warming to 1.5°C — is only 400 gigatonnes of carbon dioxide (GtCO2) as of the beginning of 2020. Assuming recent global emissions levels of 36.4 Gt CO2 per year, this amounts to only about 10 years before the budget is exhausted. This is not even considering non-CO2 emissions like Methane.
The ten years from 2021 – 2030 will be make-or-break for the earth. If CO2 and other emissions cannot be curtailed with immediate effect, then limiting global price rise to 1.5°C by 2050 will remain a pipe dream. Weather conditions of 2021 will appear mild and gentle compared to what is likely to be unleashed in the last fifty years of this century.
The task of saving the planet from climatic cataclysm is probably the hardest challenge humanity has ever faced. The entire human race needs to come together to fight this battle collectively like never before if we are to have any chance in saving this beautiful, blue, vulnerable planet of ours.