Anindya Sengupta
The NITI Aayog published the status report on Sustainable Development Goals -2020-21. United Nations in 2015 has set up 17 sustainable development goals for countries like India. NITI Aayog started publishing a status on 13 of these 17 sustainable goals since 2018. The first such report was published in December, 2018. In this article IPD focuses on the performance for SDG 1 and SDG 2.
‘SDG Goal 1: No Poverty’ index is measured using five indicators: (a) population living below the poverty line (b) household with health cover (c) people getting employment under MGNREGS (d) social protection and (e) those living in ‘kuchha’ houses. The measure is calculated for the all India level as well for the state level separately. ‘SDG Goal 2: Zero Hunger’ index comprises of 7 indicators – (a) rural households covered under PDS (b) stunted children under 5 years (c) anaemic pregnant women (d) 6 to 69 months old children who are anaemic (e) underweight children in 0-4 years (f) rice, wheat and coarse cereals produced in kg/ha (g) gross value added in agriculture per worker. Higher the value of the index better is the performance for both SDG 1 and SDG 2.
SDG 1: NO POVERTY
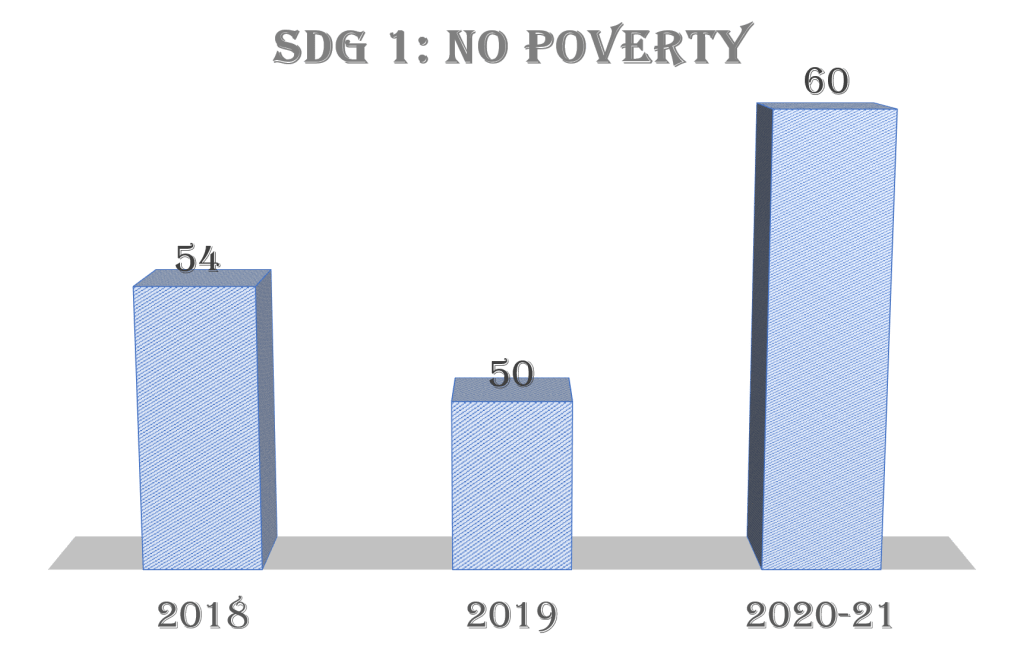
The latest report suggests a significant improvement in the index value of sustainable development goal one over time. There has been a decline in 2019 compared to 2018. 2020-21 saw an increase. Let us see how the major states have fared in terms of this goal.
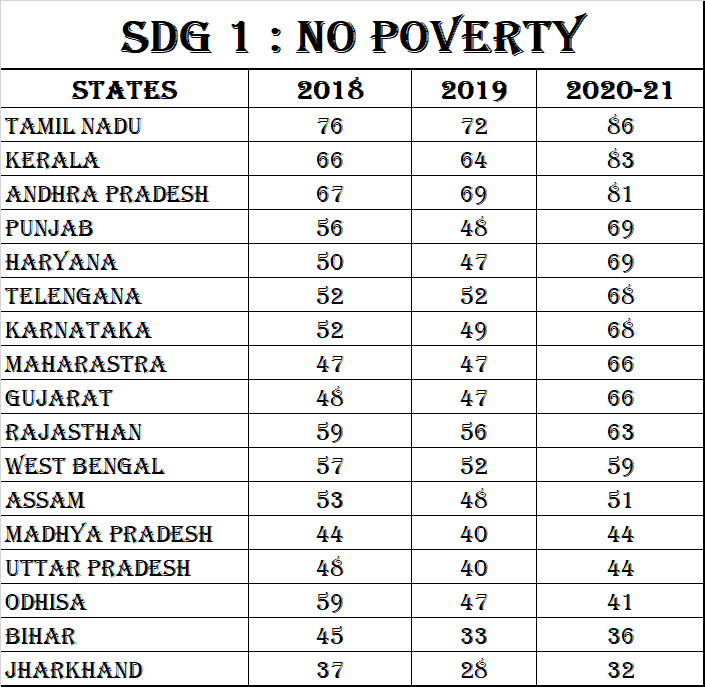
The southern states of Tamil Nadu, Kerala, Andhra Pradesh continue to perform very well in terms of this goal. Jharkhand, Bihar and Odhisa are the bottommost performer in terms of this index. Almost all states have seen improvement in this goal in comparison with 2019 apart from Odhisa which has seen a steady decline in this index. It must be noted here that the states who already were doing good in terms of this index, continued to perform better in comparison to states who where not doing good in this index. The gap between the topmost state and the bottom most state has been seeing a constant increase over time. The difference in the index value of the topmost state and bottom state stood at 39 in 2018. In 2019 the same difference increased to 44 while in 2020-21 this has further increased to 54.
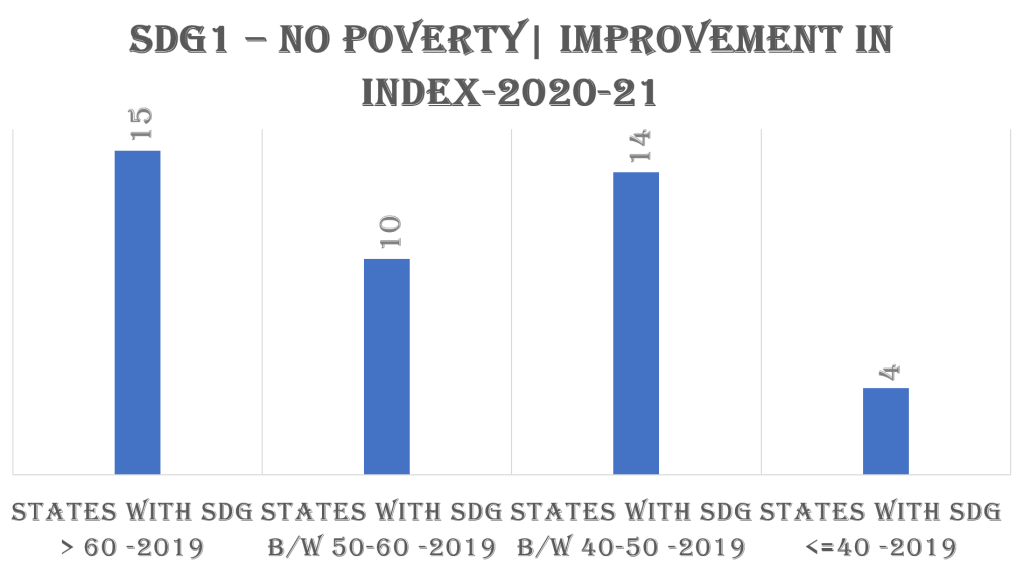
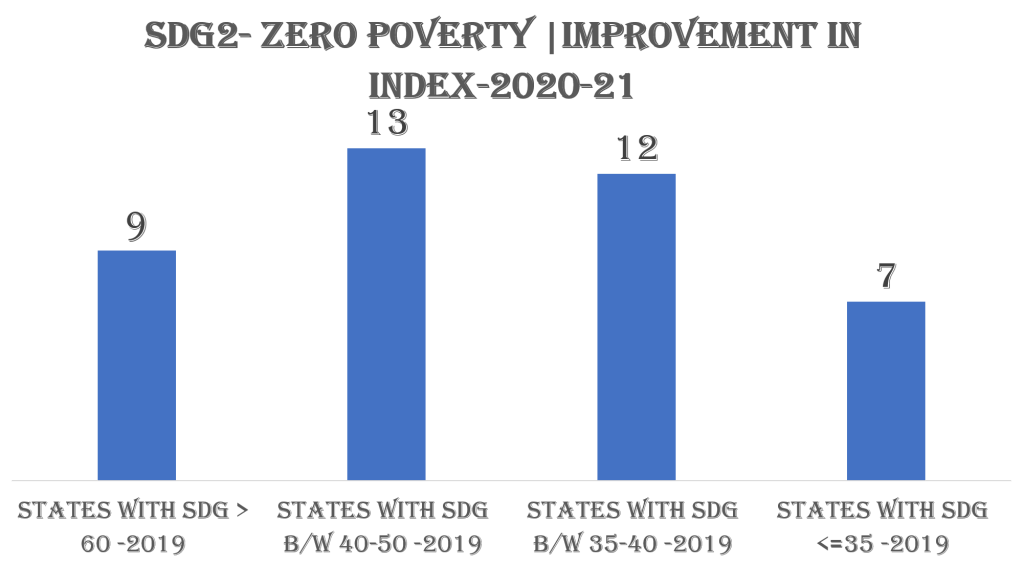
It can be seen that the average increase in 2020-21 in index value for states which were already in the top in terms of 2019 has been maximum. While the top states in terms of 2019 performance have seen a average increase of 15 in index value, the same increase value is only 4 for states which fared in the bottom in 2019. So while we see an overall improvement in the index value, the states who continued to do better are showing higher improvement in comparison with states who were not doing better. This is increasing the overall inequality within the states.
SDG 2: ZERO HUNGER

In terms of this goal, there has been a significant decline in the index value in 2019 as compared to 2018. In 2020-21 it has seen an increase again. Now the index value is at the level of 2018. Let us examine how the major states have fared in terms of this goal.
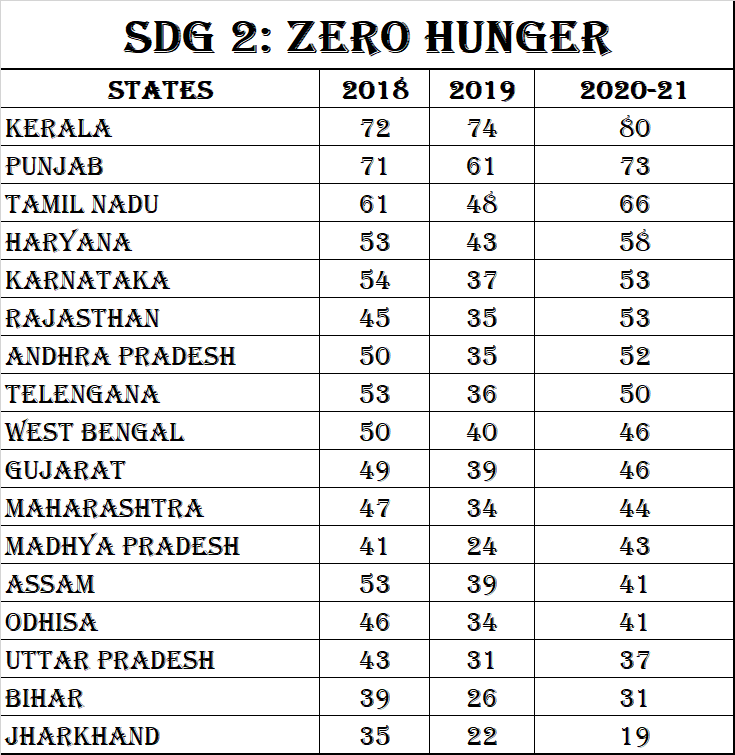
The states of Kerala, Punjab continue to perform very well in terms of this goal. Tamil Nadu sees a significant increase in the index value. Jharkhand, Bihar and Uttar Pradesh are the bottommost performer in terms of this index. Almost all states have seen improvement in this goal in comparison with 2019 apart from Jharkhand which has seen a steady decline in this index. Assam is the other state which is seeing a steady decline in the index over the years. The top states have surpassed the value of the index in 2018 in 2020-21. But many of the the bottom ranked states have seen index value less than 2018. The gap between the topmost state and the bottom most state has been seeing a constant increase over time. The difference in the index value of the topmost state and bottom state stood at 37 in 2018. In 2019 the same difference increased to 52 while in 2020-21 this has further increased to 61.
This index also shows some amount of inequality when compared to the index value of 2019. However this is less severe than the situation with SDG 1 of zero poverty.
Conclusion
Both in terms of sustainable development goals of No poverty and Zero Hunger, while overall there has been a improvement in performance across the country, the inequality within states has been seeing a considerable increase over time. The states which where doing better continue to do much better while states who were not doing good, continue to perform poorly. This is a area of concern. IPD hopes more focus will be given to the bottom performer states to ensure there is a uniform improvement across the country in future.

unequal distribution of resources is the root of poverty and hunger.
LikeLike