The NITI Aayog published the status report on Sustainable Development Goals -2019 on 27th December, 2019. United Nations in 2015 has set up 17 sustainable development goals for countries like India. NITI Aayog started publishing a status on 13 of these 17 sustainable goals since 2018. The first such report was published in December, 2018. The report published in 2019 therefore not only talks about the status in terms of the SDG, but also provides a comparison of the situation with respect to 2018. In this article IPD focuses on the performance for SDG 1 and SDG 2.
‘SDG Goal 1: No Poverty’ index is measured using five indicators: (a) population living below the poverty line (b) household with health cover (c) people getting employment under MGNREGS (d) social protection and (e) those living in ‘kuchha’ houses. The measure is calculated for the all India level as well for the state level separately. ‘SDG Goal 2: Zero Hunger’ index comprises of 7 indicators – (a) rural households covered under PDS (b) stunted children under 5 years (c) anaemic pregnant women (d) 6 to 69 months old children who are anaemic (e) underweight children in 0-4 years (f) rice, wheat and coarse cereals produced in kg/ha (g) gross value added in agriculture per worker. Higher the value of the index better is the performance for both SDG 1 and SDG 2.
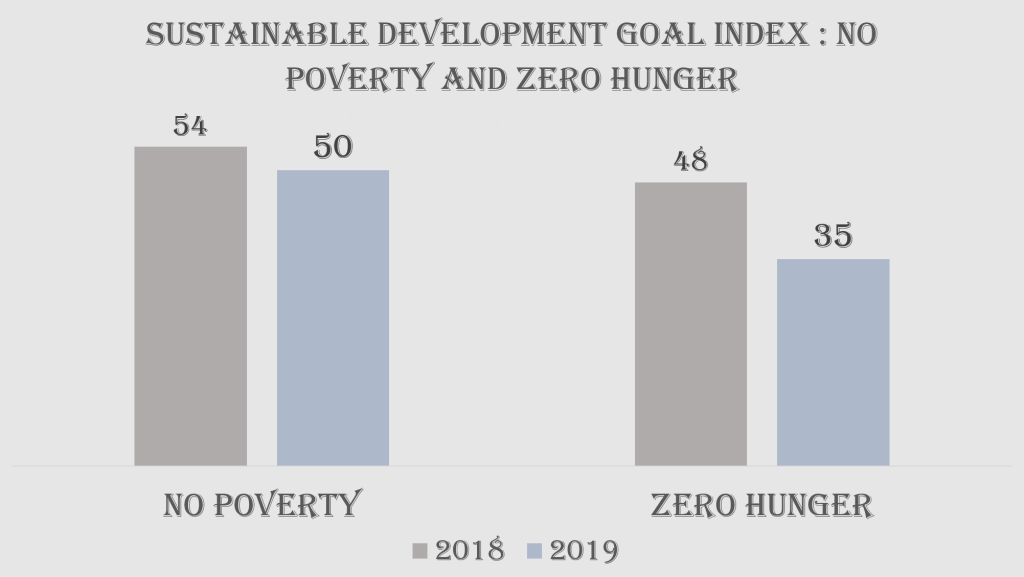
In terms of both SDG 1 and SDG 2 index, there is a decline in performance observed in 2019 as compared to 2018. The drop in performance is more severe for SDG 2- Zero Hunger where we see a 13 point drop in the index in 2019 as compared to the previous year. This is an alarming situation where we see a deterioration in terms of poverty and hunger. The results are in hands with the findings of the global hunger index where India holds a dismal 102 nd rank.
In terms of poverty, media reports recently cited that the unpublished report on Consumption survey of National Statistical Organization (NSO) cites a decline in monthly per capita expenditure in 2016-17 as compared to 2011-12. This was the first time after independence that a decline in MPCE is noted hinting increase in poverty. Government however discarded the survey citing data quality issues and initiated the process for a new survey. The findings of NITI Aayog that there is a deterioration of the poverty index hints to similar results as the unpublished report.
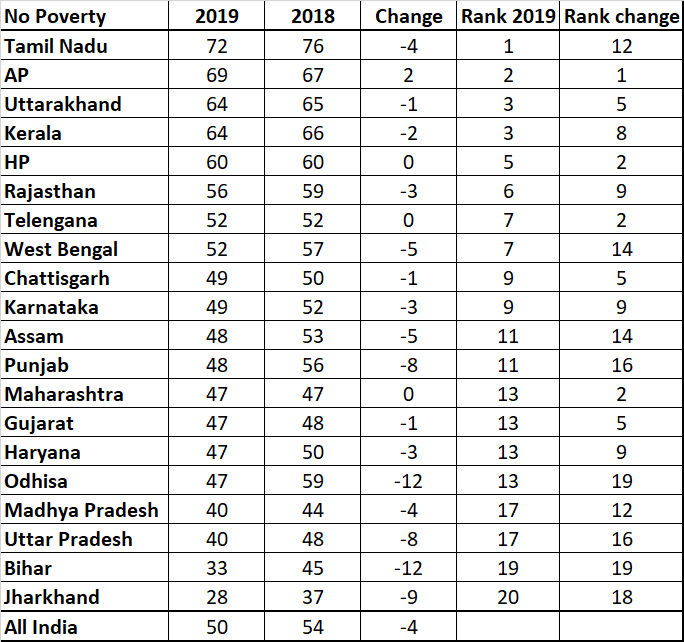
When we look at the state level, it is found that Tamil Nadu, Andhra Pradesh and Uttarakhand are the top 3 states in terms of ‘SDG Goal 1 – No Poverty’ index in 2019. Jharkhand, Bihar and Uttar Pradesh are the bottom three states. These three low performing states also showed severe decline in performance in 2019 as compared to 2018. Apart from Andhra Pradesh, no other major states showed improvement with the decline severe in already bottom ranked states. So while majority of the states performed badly in terms of poverty, the poorer states became more poorer. This is an alarming trend.
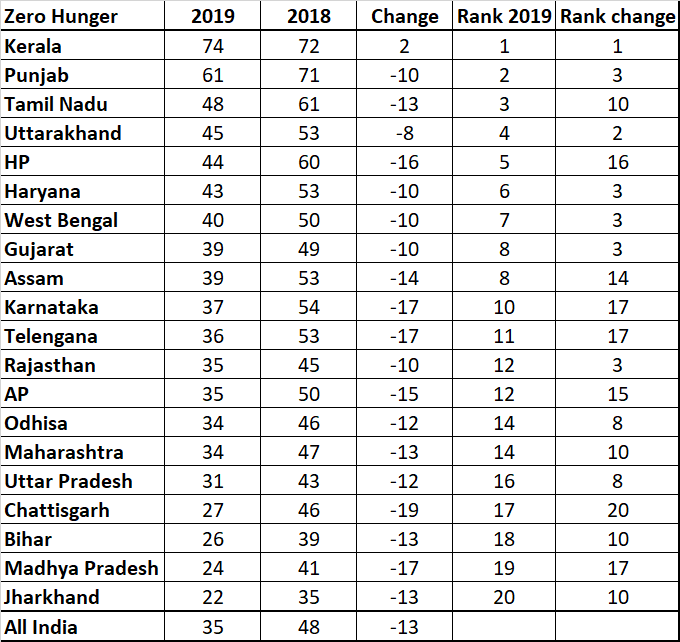
In terms of the ‘SDG Goal 2 – Zero Hunger’ index, Kerala, Punjab and Tamil Nadu are the top ranked states and Jharkhand, Madhya Pradesh and Bihar are the bottom ranked states in 2019. In terms of comparison with 2018, Kerala is the only state which showed improvement while all other states showed significant deterioration. Here also the deterioration is severe for bottom ranked states as compared to the top ranked states.
So in terms of both poverty and hunger it is seen that not only there is a decline in India’s overall performance in eradicating poverty and hunger, almost all states has sees a decline. The states with low performance showed a higher drop in performance. This is a severe problem. This needs to be addressed as soon as possible. NITI Aayog provides no explanation in terms of the change in performance.
Why India is witnessing rise in poverty and hunger after having registered extraordinary improvement between 2005-06 and 2015-16 – as was revealed by the 2018 UNDP-Oxford report on multidimensional poverty index (MPI) remains a reason to worry. The unreleased consumption survey could have provided some explanation on how severe is the problem and could have helped in providing explanations. There has been a significant rise in unemployment, with the unemployment rates are highest ever in last 45 years. Further to that there has been a slowdown with the quarterly GDP growth declining to 4.5%. This is a result of slowdown in domestic demand as well as a decline in exports. All of these factors have an impact directly or indirectly on poverty and hunger and can be the potential reasons for this deterioration.
IPD sincerely hopes that action in this regard will be taken with regard to this in the upcoming budget and thorough focus will be given to reverse the trend in the Indian economy.
