The Ministry of Statistics, Programme & Implementation has published two important reports for Indian Economics performance for the first quarter of FY, 2024-25( April to June, 2024). One is the data on GDP and the other is the employment survey data for Urban India. The article focuses on both of these reports. The only point to note is that the employment scenario of rural India for the same period is not available at this point for analysis.
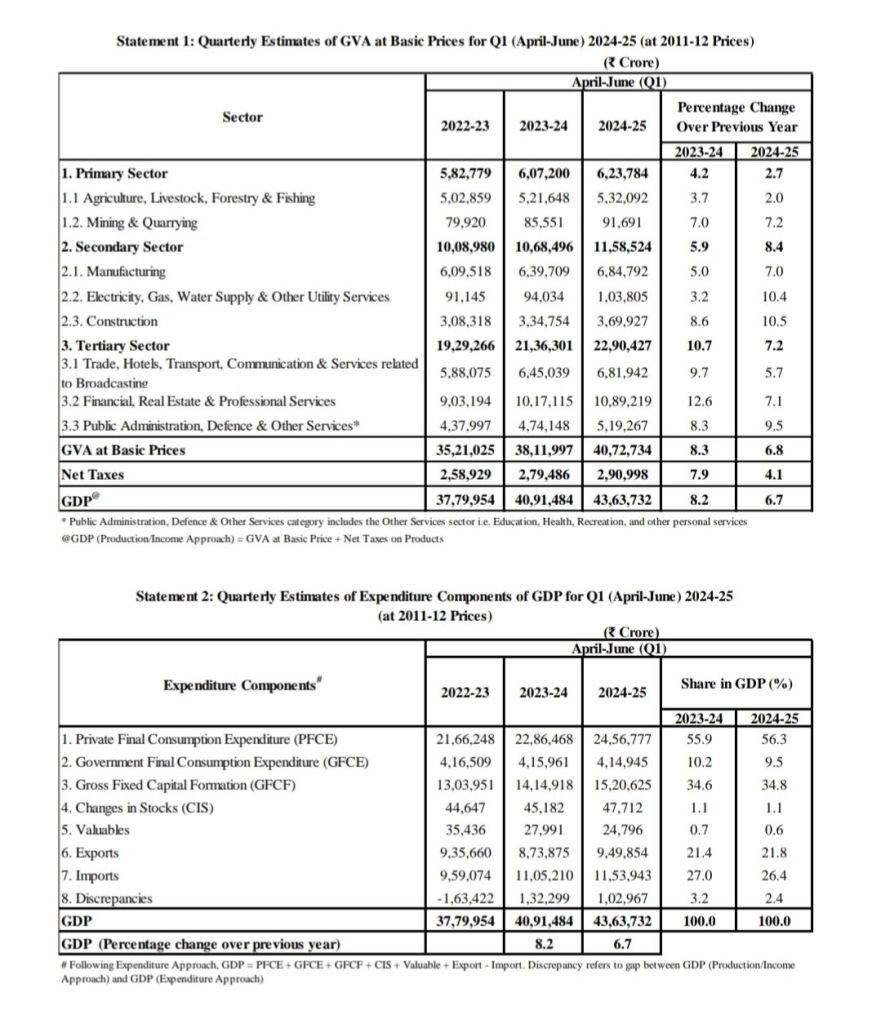
Between 2022-23 and 2023-24, GDP grew by 8.2%, indicating strong economic performance. This growth suggests a healthy recovery or expansion of the economy during this period, primarily driven by robust activity in the tertiary and secondary sectors. However, from 2023-24 to 2024-25, the GDP growth rate slowed to 6.7%. While still positive, this deceleration could be attributed to several factors, including the economy reaching a more mature stage in its recovery, potential global economic headwinds, or necessary internal economic adjustments.
### **2. Sectoral GVA and Employment Trends:**
#### **Tertiary Sector:**
– **GVA Growth:** The tertiary sector showed strong growth in GVA, especially in 2023-24 (10.7%). However, there was a slowdown in 2024-25 (7.2%).
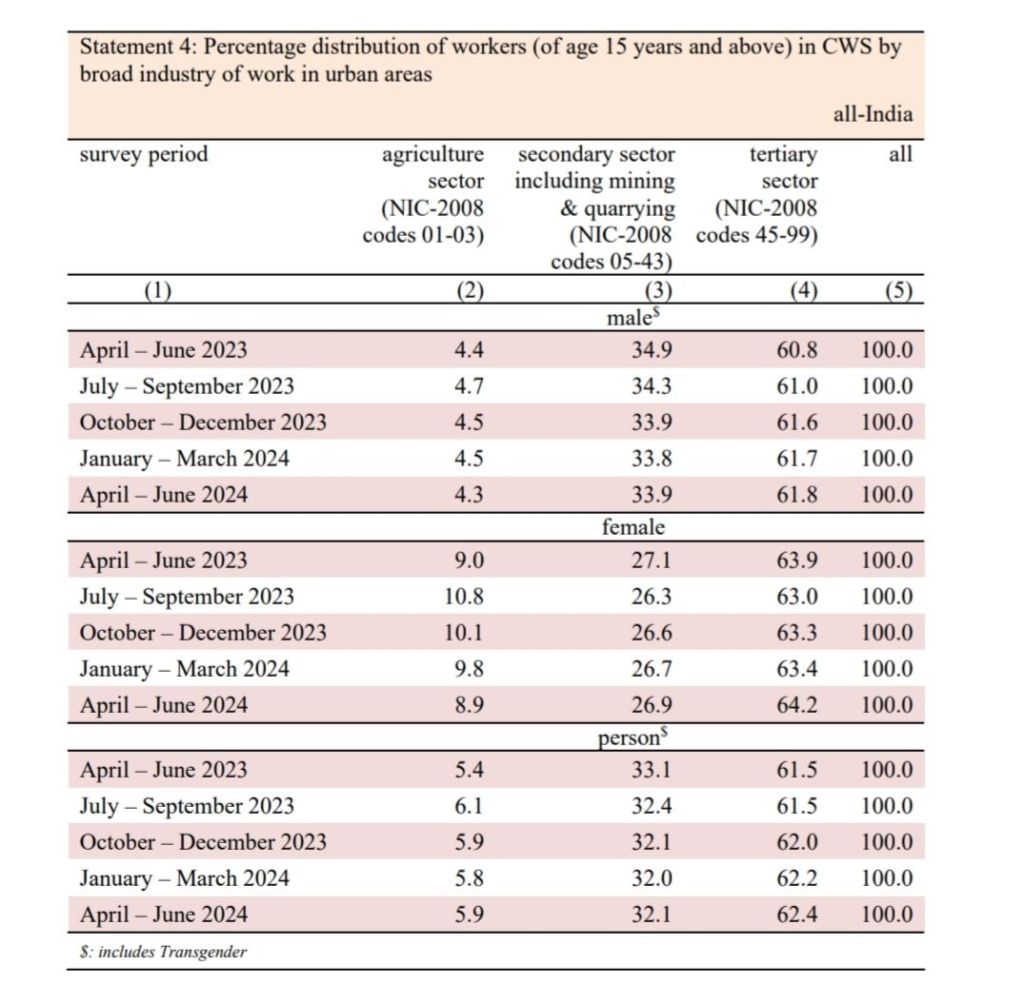
– **Employment Trend in Urban India:** The employment share in the tertiary sector increased by 0.9% from April-June 2023 to April-June 2024. Interestingly, this rise in employment did not align with the sector’s GVA growth trend, suggesting that while more jobs were created, the economic contribution per job might have declined, indicating potential issues with productivity or an increase in lower-wage jobs.
#### **Secondary Sector:**
– **GVA Growth:** The secondary sector exhibited steady GVA growth, with an especially strong performance in 2024-25 (8.4%), which was even higher than the growth observed in the 2023-24 period.
– **Employment Trend in Urban India:** Despite the sector’s strong economic growth, the employment share decreased by 1.0%, suggesting that the sector might have become more capital-intensive, requiring less labor as productivity increased. This could indicate a trend towards automation or more efficient use of resources, reducing the need for labor even as output grows.
#### **Primary Sector:**
– **GVA Growth:** The primary sector displayed the slowest GVA growth, with a declining growth rate over the years.
– **Employment Trend in Urban India** Despite the minimal GVA growth, the employment share in urban agriculture increased by 0.5%. This suggests that economic pressures or changes in the urban labor market might be pushing more workers into the primary sector, despite its relatively low economic output.
One important thing to note here is that this analysis is based on employment data of urban India only. In rural India, a sizeable proportion of people work for the primary sector and if that data is available then this analysis will change significantly
### **3. Consumption and Investment Patterns:**
#### **Consumption:**
– Private consumption (PFCE) remains the most significant driver of GDP, with steady growth over the years. This reflects a growing consumer base. However, the trend in sectoral employment in urban areas indicates that this consumption-driven growth might not be sustainable in the long term. The sectors with increasing employment share are experiencing slower growth rates, while sectors with higher growth rates are seeing a decline in employment share. This divergence could signal future challenges in maintaining robust consumption levels.
– Government consumption (GFCE) has slightly declined, indicating possible fiscal restraint or a strategic shift towards capital expenditure, potentially aiming to bolster long-term economic growth rather than immediate consumption.
#### **Investment:**
– Gross Fixed Capital Formation (GFCF) has shown strong growth, particularly in 2024-25, indicating optimism about future economic growth. This suggests that businesses and the government are investing heavily in infrastructure and other fixed assets, which could provide a foundation for sustained economic expansion.
– The increase in changes in stocks suggests that businesses are optimistic about future demand, possibly preparing for expected growth by increasing inventory levels.
### **4. External Sector Dynamics:**
– The external sector presents a mixed picture. Exports initially declined in 2023-24, possibly due to global economic conditions or trade barriers, but then recovered in 2024-25. Meanwhile, imports grew strongly in 2023-24 before slowing down in 2024-25. The net effect of these external sector dynamics likely exerted a negative influence on GDP growth in 2023-24 but might have improved in 2024-25 due to the rebound in exports, contributing positively to overall GDP.
### **5. Valuables:**
– The decline in the purchase of valuables, such as gold, suggests that people might be moving away from traditional stores of wealth. This shift could reflect greater confidence in other investment avenues or a preference for more liquid or productive forms of investment, aligning with the broader economic trend of increased investment in fixed capital.
## **Unemployment Rate Comparison: April-June 2023 vs. April-June 2024**

1. Overall Stagnation: The unemployment rate saw a slight decrease from April-June 2023 to April-June 2024 across all categories (age groups, genders, and overall population). This indicates a relatively stable employment situation in 2024 compared to 2023, with only minor improvements.
2. Youth Unemployment:The unemployment rate among the younger age group (15-29 years) remains significantly higher than the overall rate, though it did see an improvement from 17.6% to 16.8%. This suggests that efforts to employ young people may be yielding some positive results, but the high unemployment rate in this demographic remains a concern.
3. **Gender Disparities:** The unemployment rate for females remains higher than for males across all age groups, although there was a slight improvement in 2024. The persistent gap between male and female unemployment rates indicates ongoing challenges in achieving gender parity in employment.
4. **Stability in Older Age Groups:** For individuals aged 15 years and above, as well as across all ages, the unemployment rates remained relatively stable, with very slight improvements. This stability suggests that the employment market for older individuals may not have seen significant changes during this period.
## **Conclusion:**
The analysis of GDP and GVA growth, combined with employment and unemployment trends, paints a complex picture of the economy between Q1, FY 2022-23 and Q1, FY 2024-25. While overall GDP and sectoral GVA growth remain positive, there are signs of deceleration, particularly in the tertiary sector. This deceleration, coupled with the shifts in employment patterns, suggests potential structural changes in the economy. The divergence between employment growth and GVA growth in key sectors could indicate challenges in productivity or shifts towards more capital-intensive production processes.
The unemployment data further underscores the persistence of certain challenges, particularly in youth employment and gender disparities. While the overall employment situation shows some stability, the relatively high unemployment rates for younger individuals and females highlight areas that may require targeted policy interventions.
In conclusion, while the economy continues to grow, there are underlying issues that could affect the sustainability of this growth. Addressing the disparities in sectoral growth, productivity, and employment, alongside maintaining a balanced approach to consumption and investment, will be crucial for ensuring long-term economic stability and inclusivity.
