The loksabha election results have been declared on June 4th and the ruling NDA coalition got 293 seats, a significant drop from the last general elections in 2019. The major party BJP missed the majority in itself and settled for 240 seats.
In this article we examine is there any pattern in the results across the richer states as against the states which are poorer. In order to measure the states in terms of income we consider the Gross State Domestic Product per capita of 2022-23 published by the Ministry of Statistics, Programme & Implementation, Government of India. For our analysis purpose we only consider the states with more than 10 states to define the top and bottom 5 states in terms of GSDP per capita. The top 5 states in terms of GSDP per capita and with more than 10 lok sabha seats are Telengana, Tamil Nadu, Gujarat, Haryana and Karnataka. The bottom 5 states with similar criteria are Assam, West Bengal, Jharkhand, Uttar Pradesh and Bihar.
Let us examine how the result varies across all India, Top 5 states and Bottom 5 states.
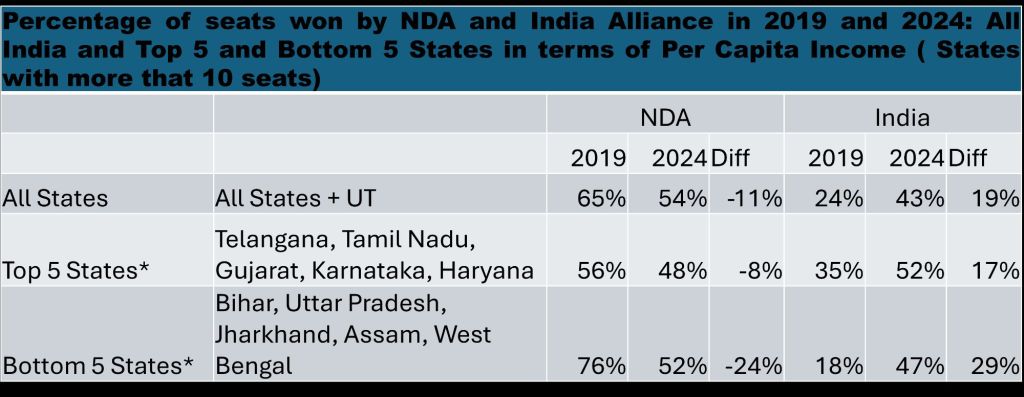
From the table above, we can see that while at an all India level, NDA has lost around 11 percent of seats, the same loss has been in the magnitude of 24 percent in the bottom 5 states in terms of GSDP per capita. The loss has been lesser than all India levels in the top 5 states. As UP has 80 seats and it biases the bottom 5 cohort, we removed UP and did the analysis and found that the loss for NDA stands at 16 percent which is also higher than the all India level of 11 percent.
Similarly for the bottom 5 states it is clearly seen that the India alliance has gained more in this cohort ( 29 percent) than what they have gained in the all India level (19 percent). Thus the above table clearly shows that the GSDP per capita falls the decline in seats of NDA is severe and subsequently the increase in seats of India alliance is more. Hence the lower the per capita income of the state, higher is the loss of NDA and higher is the gain of India alliance in terms of seats as per the above table. It needs to be noted here though even after the severe loss, NDA still gets more than 50 percent of seats in the bottom 5 states cohort, but the gap between the two alliances reduces significantly.
Does this mean that in the top 5 states cohort in terms of GSDP per capita there is uniform lesser loss for NDA. Or are there segments within the top 5 states where there is a different trend. Let us examine.
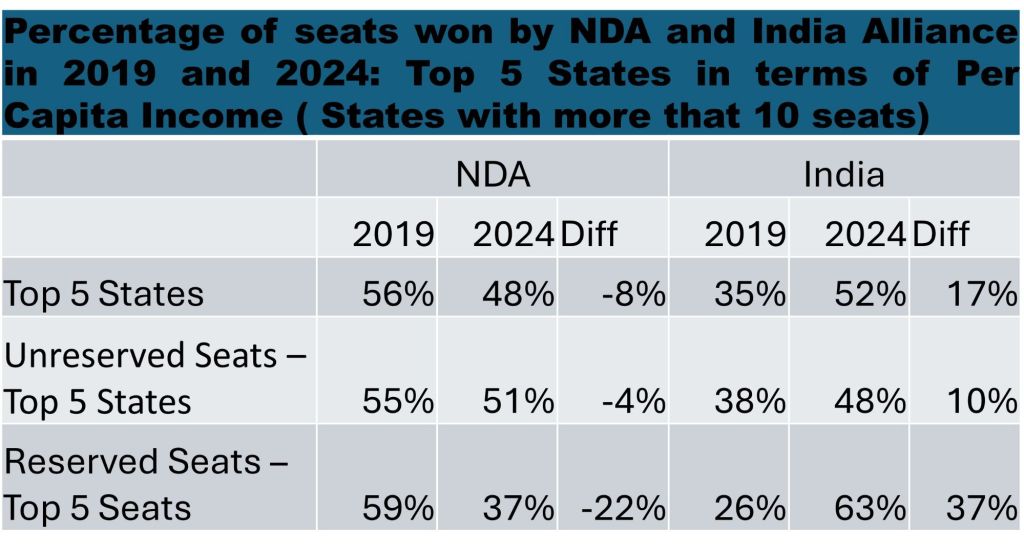
When we analyse the seats of the top 5 states across the unreserved seats and reserved ( SC, ST ) seats category, we can clearly see a pattern that emerges within the top 5 states cohort in terms of GSDP per capita.
The above table clearly shows that while the loss of seats for NDA is minimal ( 4 percent) in the unreserved seats, the same is 22 percent in the reserved seats. A loss of 4 percent seats for a government which is in office for 10 years can be explained by some kind of anti incumbency and can be a normal trend. But the loss of 22 percent clearly suggests that in the marginalized social groups there has been a much severe loss of seats for NDA and hence a subsequent significant gain for India alliance in these seats. Thus for this cohort it is clearly seen that for the marginalized social groups the loss of seats for NDA has been severe.
Has the same social group factor impacted on the bottom 5 states cohort also. Let us look into it.

From the above table, we can see that while the loss of seats for NDA is more in the reserved seats than in the unreserved seats and the total seats for the bottom states cohort, the difference is not very significant and it remains in a similar range so is the gain of seats for the India alliance in these states.
Thus the social group does not have a significant impact in the bottom state cohort. Here the magnitude of loss of seats is almost the same across all types of seats with it marginally higher for the reserved seats.
Thus to conclude, we can see that at an overall level income inequality has a significant impact in determining the pattern of results with NDA losing more seats in the poorer states. Even within the richer states the loss for NDA and subsequently the gain for India alliance has been more for the marginalized social groups. Thus social groups have a significant degree in determining the pattern especially in the richer states. It has an impact in the poorer states as well, but the impact there is limited.
Thus it can be said that it is the marginalised section be it in terms of income or in terms of social groups ( marginalised groups have significantly poorer economic and social outcomes in almost all development parameters) that have shown an inclination to move away from NDA and towards the India alliance leading to the outcome that we have witnessed in this election.
